To make sure your calendar, event reminders, and other features are always
correct, please tell us your time zone (and other details) using the
drop-down menus below:
Set Date/Time format:
In 12 Hour format the hours will be displayed as 1 through 12 with “a.m.” and “p.m.”
displayed after the time (ex. 1:00p.m.). In 24 hour format the hours will be displayed as 00 through 23 (ex. 13:00).
You can always change your time zone by going to your Account Settings.
Use the dropdown menu to view the events in another time zone. The primary time zone will be displayed in parentheses.
Use the dropdown menu to view the events in another time zone. The primary time zone will be displayed in parentheses.
Check the items that you want displayed. Uncheck all to hide the section.
Calendars
Files
Addresses
To Dos
Discussions
Photos
Bookmarks
The “Switch Navigator” button will no longer be available after February 14, 2017.
Please learn more about how to use the new Navigator by clicking this link.
Copy of Research Study Notes -- February 28, 2009 12:58 pm.
KEY (not always used, but used the same way) = Main PointsKey Words (get you points on tests)Remember: these will save your life
1/31 � Chapter 10 Overview:
Descriptive Statistics: Sum or Description of a population Inferential Statistics: Generalization of populations from samples
Sample means (M) or proportions (P) allow us to infer a plausiblevalue of a characteristic
Confidence Intervals:
A sample gives us a statistic (sample M or P). We are unable to say exactly what the population mean or proportion is. To get around this we say we have a confidence that our parameter lies with in an interval. This interval is centered around a sample proportion (a mean). Basically its a point estimate with a margin of error we tack on, a Confidence Interval.
See book Definition for more info
Confidence Level (C): For every Confidence Interval there is a C
C is how much confidence" we have in our method. often choices for confidence levels are 90%, 95%, 99%.
Remember: A Confidence Level is not a probability
How to read a C: a C of 90% means
"in the long run, 90% of the results from this method will capture the true value of the population parameter being estimated within the confidence interval."
See book definition for more info
Applied: Confidence Interval for a pop. mean (we are currently using z-intervals)
To mix up a good C we work with three things
SRS
Pop. Mean (unknown)
Standard deviation (won't have in reality, but have in current problems)
In order to use z-intervals we MUST have #'s 1 and 3.
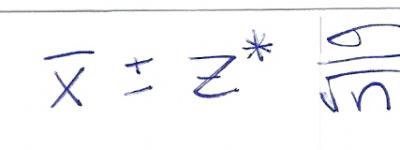
A level C confidence interval of M is:
Z* (actual symbol) = Upper Critical Value of S.N.D. (z-distributions!)
Translated this means C is dervided from the SRS mean plus and minus Z* times the standard deviation over the population2 Where as Z* is the positive value of the area to the left of one half the non confidence. A confidence of 99% leave 1% left over, half that is .005 - find that on the Z-Score box or witht he calc controls below and BAM you have your Z*!
How do we find the Z*? just use {2nd} {Distr} -> {3}(invNorm) this gives -> invNorm(area to left)
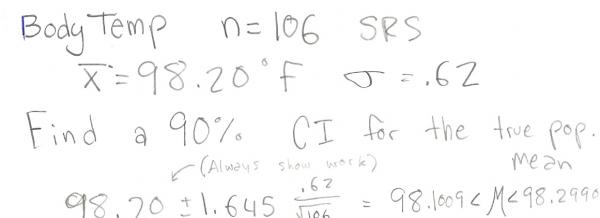
Remember: book may write in interval notation: (98.1069,98.2991)Don't write this way! We write like this: 98.1009<M<2.9906
Here is a complete problem:
Text reads "always show work"
2/1 - Chapter 10
Steps for full credit on interval problems:
1. Name the Interval
Z-Interval for population mean
2. State and Check the conditions
SRS
Standard Deviation Known
"Something about Norm Dist."
A) Given population distribution is approximately normal or B) Sampling Distribution is Approximately normal, n is large by the central limit theorem.
Remember:Do not use "it" when writing any of this!!!
3. Show the work
4. Write your final answer with the mean in between (_________<M<_________)
How to Interpret a C
Pat Phrase (plug in your own data in the underline sections):
"I am 99% confident that the true mean number of years general managers spend with the company is between 11.01 and 12.59"
Creation date: Feb 28, 2009 12:58pm Last modified date: Feb 28, 2009 12:58pm Last visit date: Jun 8, 2026 6:02pm
Attach this document to an event, task, or address
You can attach a link to this document to an event in your Calendar, a task in your To Do list or an Address. Check the boxes below for the data you want to
bring into the event’s or task’s description, and then click “Select text to copy” to have the next event or task you create or edit have the document text and link.